Back
23 Jan 2020
S&P500 Price Analysis: Index hovering near the all-time high
- The uptrend remains intact within the bullish channel.
- The level to beat for bulls is the 3350 resistance.
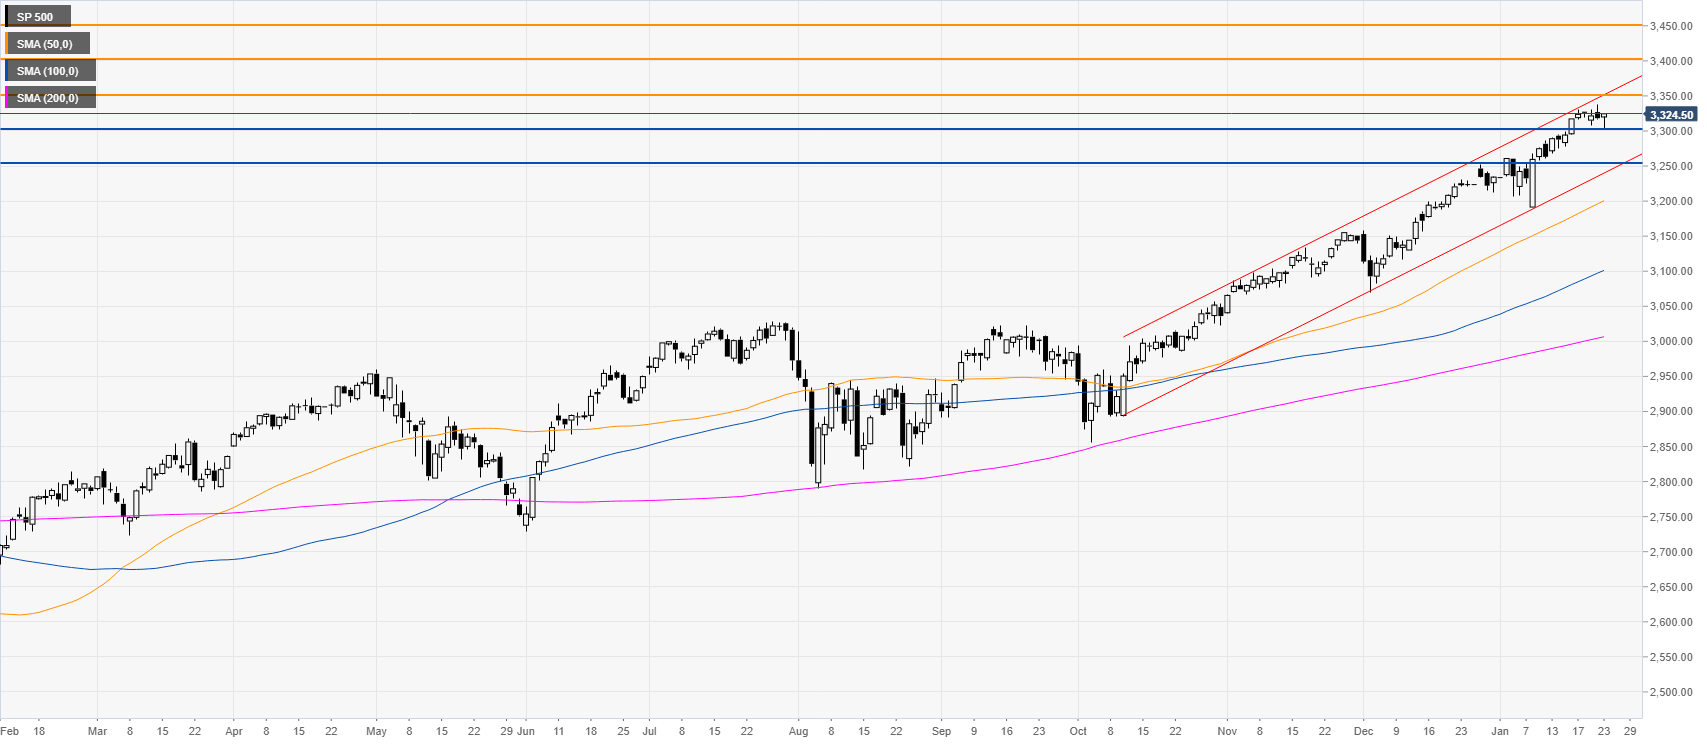
S&P500 daily chart
The US stock index is trading in a bullish channel above the main daily simple moving averages (SMAs). The path of least resistance is to the upside and if bulls break the 3350 resistance the market is likely to keep its bullish run trading towards the 3400 and 3450 levels. Retracements down could find potential support near the 3300 and 3250 price levels.
Additional key levels