Back
13 Feb 2020
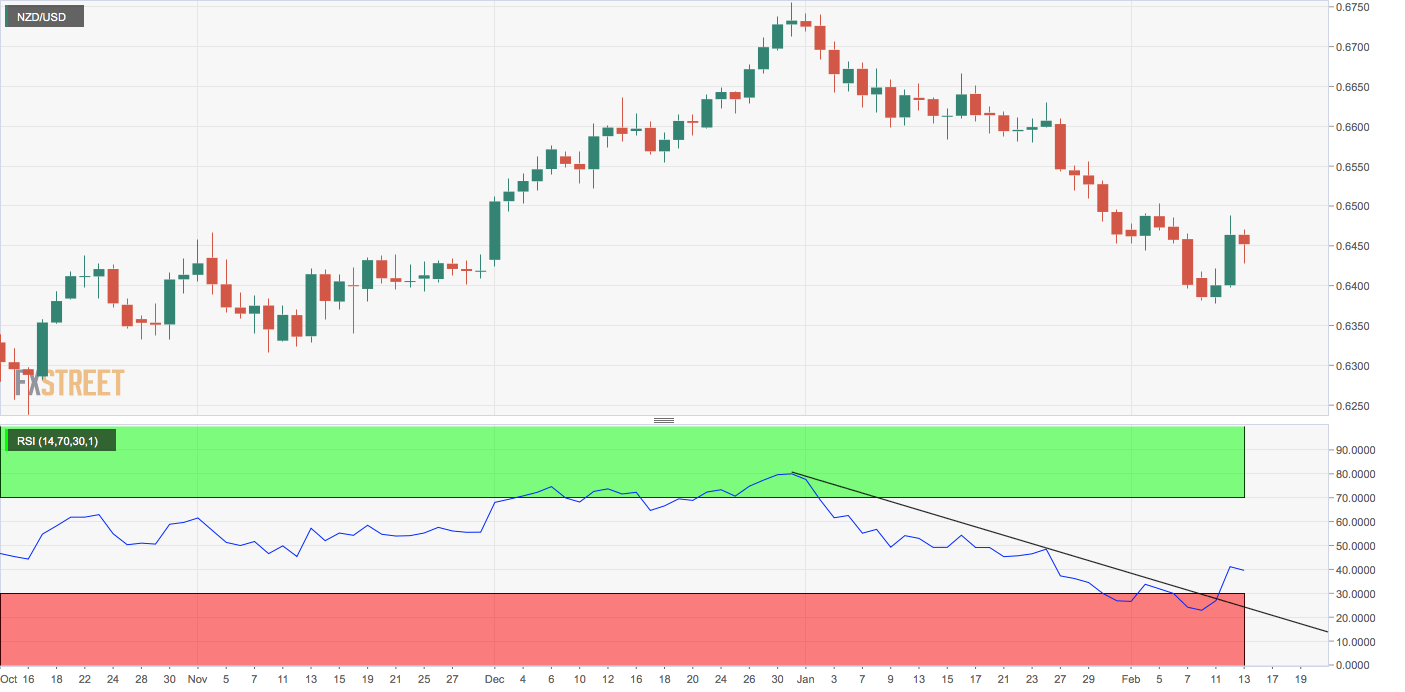
NZD/USD Price Analysis: Bounces from key MA support
- NZD/USD has bounced up from the 50-hour average support.
- The hourly chart MA studies and the daily chart RSI are biased bullish.
NZD/USD defended the ascending or bullish 50-hour moving average (MA) three hours ago and is now trading at 0.6450, representing a 0.20 percent drop on the day.
The major hour chart MAs are aligning in favor of the bulls. The 50-hour MA has crossed above the 100-hour MA and appears on track to rise above the 200-hour MA. That would confirm a golden cross on the hourly chart.
Further, the 14-day relative strength index (RSI) has violated the descending trendline – a sign the bearish trend from the high of 0.6733 observed in early January.
All in all, the immediate bias is bearish and the pair could rise to the 200-day average at 0.6497.
Daily chart
Trend: Bullish
Technical levels