Gold Price Analysis: Bulls await confirmation of inverse head-and-shoulders on H4
- Gold prices carry the bounce off 200-bar SMA.
- A short-term descending trend line from late-February portrays bullish chart formation.
- An upside break will escalate recovery moves beyond the $1,700 mark.
Despite repeated failures to take-out a short-term resistance trend line, Gold prices remain 0.07% positive while taking rounds to $1,640 during the pre-European session on Thursday.
That said, the yellow metal is forming an inverse head-and-shoulder bullish pattern on the four-hour (H4) chart that needs confirmation with a break of the neckline, currently at $1,651.
In doing so, the bullion is theoretically capable of targeting $1,750. However, it’s expected to take a rest near the latest high of $1,690 before rising further.
On the downside, 50% and 61.8% Fibonacci retracement of the bullion’s February month rise, around $1,618 and $1,602 respectively, will offer intermediate supports during the U-turn.
Additionally, 200-bar SMA near $1,592 and February-end bottom near $1,563 will be tough nuts to crack for the sellers past-$1,602.
Gold four-hour chart
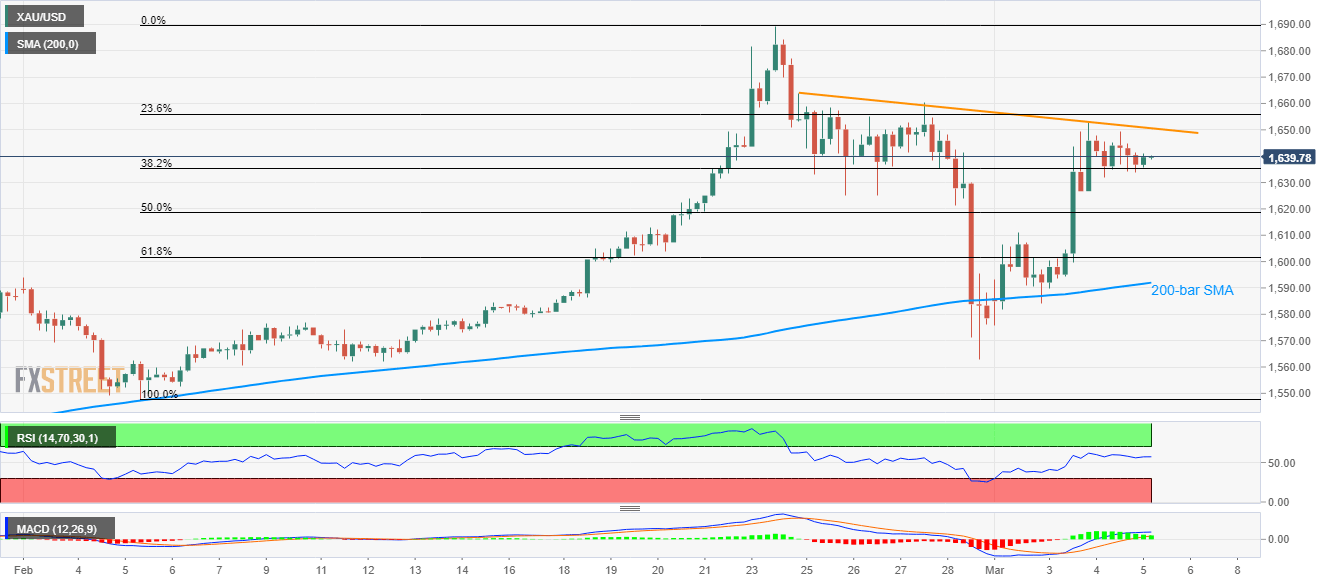
Trend: Bullish